
All Weather Capital | Thematic Research
Marketing communication for institutional allocators and consultants. Not investment advice. Company names are illustrative of the theme, not recommendations.
Executive Summary
What did last century’s wars actually get fought over? Oil, mostly. Japan hit Pearl Harbor in 1941 partly because Washington had cut its oil supply. Suez in 1956 was a fight over who controlled the canal moving Gulf crude to Europe. Both Gulf Wars sat inside the world’s largest oil province, and Western Middle East policy for seventy years has barely made sense without the price of a barrel attached to it.
There’s a new cold war underway, and it’s being fought over artificial intelligence, mostly between the US and China, with India and Europe as the two swing states. Most of the commentary fixates on chips: who has the best GPU, who controls memory. That’s only half the story. The deeper fight is over electrons, not transistors.
China generated roughly 10,000 TWh of power in 2024, more than the US, EU and India combined, and added 543 GW of new capacity in 2025 alone. That’s twice Germany’s entire grid. Its industrial power costs about a third of Europe’s. Sell-side estimates put the US on track for a net AI power shortfall of 14-24 GW through 2028. Europe’s reserve margin could turn negative before 2030. India, largely overlooked, is flagged as an upside surprise on data-center growth, provided it can fix a curtailment problem that’s already wasted 1,410 GW of renewable output since 2019.
China and India have the cost advantage. The US has the design advantage. Europe has neither, and its grid clock may be the tightest of the four.
This piece walks through the cost of power, where each grid stands today, and how fast each is building, and what that means for how capital gets positioned.
Marketing communication. Not investment advice. Capital at risk.
What did the wars of the last century actually get fought over? Strip away the ideology and look at the resource maps. Japan struck Pearl Harbor in 1941 largely because the US had cut off its oil. The 1956 Suez Crisis was, underneath everything else, a fight over who controlled the canal moving Gulf oil into Europe. Both Gulf Wars unfolded in the world’s largest oil province, and for seventy years Western foreign policy in the Middle East has been hard to separate from the price of a barrel. For a century, whoever controlled hydrocarbons held outsized leverage over everyone who needed them.
A new cold war is already running, and this one is over artificial intelligence, a contest centered on the US and China, with India and Europe playing the role of swing states. Nearly all the public commentary on this fight is about chips: who’s got the best GPU, who controls advanced memory, who out-designs whom in silicon. That framing isn’t wrong, exactly, but it’s incomplete. The deeper resource war, the one that will actually decide who can build and run the most AI compute, is being fought over electrons, not transistors. Whoever can generate the cheapest, most abundant power, and get it to a data center fastest, holds the real structural edge. It doesn’t much matter who designs the best accelerator if there’s nowhere to plug it in.
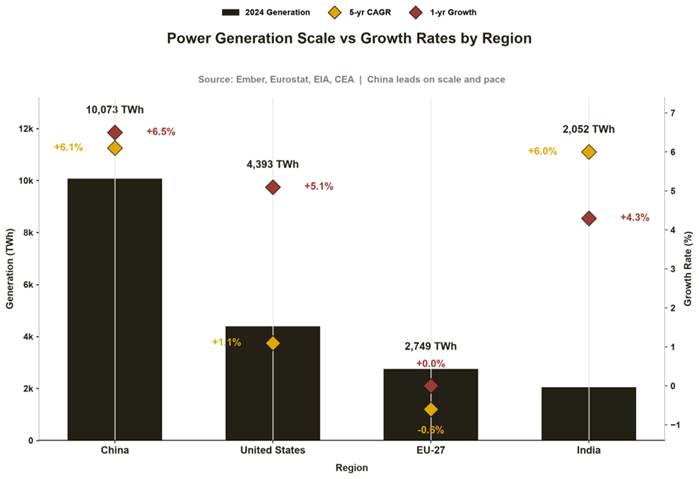
Power Generation Scale vs Growth Rates by Region
China alone out generates the US, EU and India combined, and by a wider margin on pace too: see above.
The Foundation: What Actually Powers the Grid Today
Before getting into cost and build-out rates, it’s worth looking at what each grid is actually made of right now, because the fuel mix explains both the price tag and the constraint each jurisdiction is running into.
The US still leans on natural gas for around 40% of generation, with coal down to 17% and nuclear holding near 18%; wind and solar together hit a record 17-19% of the mix in 2025, per the EIA. China remains coal-heavy at roughly 55%, but solar and wind combined have climbed to 22% of the mix, a new high, and Ember’s 2026 review notes China’s fossil generation actually fell for the first time in a decade in 2025. India is the most coal-dependent of the four at around 71%, though renewables added a record 98 TWh in 2025. Europe is the outlier: wind and solar generated more electricity than all fossil sources combined for the first time in 2025, with nuclear still supplying close to a quarter of the mix. This is the foundation everything else in this piece builds on: the cheaper, coal-and-gas-heavy grids in China and India, against the cleaner but pricier and more supply-constrained grids in the US and Europe.
The Cost of Power: A Structural Gap
The cost differences between these four markets aren’t marginal. They’re structural, and they compound. China’s baseload delivered power cost sits near US$60/MWh, with industrial retail tariffs around US$0.088/kWh, among the cheapest of any major economy. India isn’t far behind, with round-the-clock generation costs of roughly US$50-60/MWh, underpinned by a coal endowment that’s part of Asia’s three-fifths share of global reserves. The US sits mid-pack and is far more scattered: EIA data show industrial electricity averaging 8.6-9.0¢/kWh through 2026, but that ranges from 4.5¢/kWh in New Mexico to over 20¢/kWh in California. Europe carries the highest and least even costs of the four: average renewable power-purchase-agreement prices sit near US$70/MWh, and German electricity bills are projected to carry a 55% premium over Italian bills by 2030.
| Jurisdiction | Approx. power cost | Primary driver |
| China | ~US$60/MWh baseload; US$0.088/kWh industrial | Coal-flexed baseload, unmatched scale, state grid investment |
| India | ~US$50-60/MWh round-the-clock | Domestic coal, rising renewable share (25% FY27 to 35% FY31) |
| United States | ~US$86-90/MWh industrial average | Gas pricing, regional congestion, interconnection queues |
| Europe | ~US$70/MWh PPA average, rising | Import-dependent gas, carbon pricing, aging baseload |
Why Cheap Electrons Compound
This isn’t a one-off price gap. It’s a loop. Cheap power lowers the cost of manufacturing solar panels, batteries and EVs. Scale in those products pushes the equipment cost curve down further, which lowers the cost of the next tranche of power. China is inside that loop. Most of the rest of the world is still trying to get in.
That loop matters most right now in the United States, where the binding constraint on the AI build-out is no longer chips. It’s power. Broker estimates put the US power bottleneck at 55 GW between 2025 and 2028, and even factoring in creative time-to-power fixes like converting old Bitcoin sites, the net shortfall still comes out at 14-24 GW through 2028, 18-30% of what’s needed. Interconnection queues stretch for years, transformer lead times have pushed past 120 weeks, and utilities are already warning of regional shortfalls. Forecasts for US data-center capacity by 2030 range from a base case around 95-118 GW to an Agentic-AI upside case of 164 GW, and that spread alone tells you how unresolved this is. The logical next step is that the capacity America can’t power simply shifts east: the compute the US can’t bring online, Asia is positioned to absorb and run instead, on top of its own needs.
Europe’s version of the problem is worse in relative terms. The EU currently has only around 16 GW of installed data-center capacity, almost all conventional cloud, roughly five years behind the US on both build-out and AI penetration. The region’s reserve margin, the buffer between peak demand and available capacity, could turn negative after 2029 under a faster Agentic AI adoption scenario. That’s not a warning about higher prices. It’s a warning about not having enough power, full stop. Getting to even the 60 GW base case by 2035 needs an estimated US$0.8 trillion in incremental investment; the 76 GW upside case needs more.
The India Kicker
If there’s one jurisdiction the AI conversation keeps skipping past, it’s India, and that looks like a mistake. India, alongside Thailand and Singapore, ranks among the Asian markets most likely to surprise to the upside on data-center capacity, inside a broader forecast of 75 GW for the rest of Asia by 2030. India’s power consumption is now growing 1.5-2x faster than it did in the previous decade, a pace last seen in the early 2000s, and data center and AI growth in India looks underappreciated given how fast things have moved since 2024. Cleanmax, a B2B renewable power operator, is cited as evidence that large Indian data-center players are already locking in clean power at scale.
The catch isn’t cost. It’s absorption. India’s renewable share of power supply is set to climb from 25% in FY27 to 35% by FY31, backed by a target of roughly 230 GW of new renewable capacity, with battery storage scaling from about 20 GWh today to roughly 150 GWh by 2030. And yet India has cumulatively curtailed 1,410 GW of renewable output since 2019, the highest figure of any market in the dataset, which tells you grid and storage capacity, not generation cost, is what’s really standing between India’s cheap electrons and usable AI compute. India is at once the most interesting and the least de-risked of the four: cheap power and an underappreciated growth story, offset by the clearest evidence anywhere in the data that power is being generated but not delivered.
The Steelman: The US Case
The bull case for the incumbent shouldn’t be waved away. America still owns the top of the AI stack: the leading GPU designers, the high-bandwidth memory that feeds them, the software ecosystem the world builds on. The most advanced logic is still fabricated in Taiwan, not on the Chinese mainland. Washington is working to restart and expand nuclear capacity, which could ease the very power bottleneck described above, and China’s own rare-earth export controls have already pushed billions of dollars of Western financing into alternative supply chains, a tool that cuts both ways once it’s used.
The honest read: China and India lead decisively on energy cost and on the manufacturing that cheap energy enables. The US still leads on frontier compute design. The open question is whether cheap, abundant power eventually pulls the higher-value layers of the stack toward it, or whether design leadership keeps the US and its allies insulated from the energy gap indefinitely.
The Stress Test
A thesis is only as good as the arguments that could break it.
- Overcapacity destroys returns. China’s national advantage has repeatedly meant brutal margins for its listed solar and battery makers. National capacity isn’t shareholder return. The build-out can be entirely real while the stocks are value traps.
- Grid absorption, not generation, is the real constraint everywhere except China. Building generation is the easy part; integrating it is the hard part. India’s 1,410 GW of cumulative curtailment is the starkest proof of that. Europe’s negative reserve margin by 2029 is the clearest forward warning. The US net shortfall of 14-24 GW through 2028 shows the same problem even in the world’s most capital-rich market.
- The clean story is directional, not finished. China’s coal generation fell for the first time in a decade in 2025, even as coal capacity keeps getting added as insurance. Underwrite the trend, not a completed transition.
- Trade walls cap the scale that funds the advantage. US and EU tariffs on Chinese EVs and solar already lock China’s champions out of the highest-margin export markets, capping the scale that funds the cost edge in the first place.
- Rare earths cut both ways. Export controls proved China can weaponize the supply chain. The same move is now accelerating Western alternatives, a slow-burn, three-to-five-year threat to how durable that leverage actually is.
- The forecast spread is itself a warning sign. US 2030 data-center capacity estimates run from roughly 95 GW to 164 GW depending on which adoption case you use. That gap says a lot about how uncertain the power side of this, not the compute side, really is.
The Measured Verdict
The build-out advantage is real, and on current evidence it’s still widening. China’s scale, speed and cost aren’t close calls. India adds an underappreciated second leg: cheap power, accelerating demand, a credible upside case, but it also carries the worst curtailment problem in the entire dataset. The US keeps the frontier-compute lead but is running into a power shortfall it can’t fully solve at current build rates, serious enough that Asia is expected to absorb the AI capacity America can’t power. Europe starts furthest back and faces the most binary outcome of the four: a reserve margin that’s on track to go negative before 2030.
From a practical point of view, much of the power side of the AI build-out is listed in emerging markets, and a portfolio built on developed-market indices only owns little of it. We have positioned the AWC GEM Fund accordingly, with an overweight in power equipment, batteries and grid metals. Because the returns are selective, we own no utilities and no Chinese solar manufacturers, and we keep to our valuation discipline. In the third quarter we took profits in WEG and Freeport-McMoRan after strong runs. With the realisation that the compute that the US cannot power will shift towards Asia, is reflected in our largest exposure, an overweight in information technology held mainly through the AI supply chain in Taiwan and Korea.
The advantage is national. The returns are selective. The macro case for energy as the deciding factor here is bullish across all four markets, just in different ways, but the micro case demands picking carefully, to avoid both China’s overcapacity value traps and the grid-absorption risk now showing up everywhere from Virginia to Gujarat to the gap between German and Italian power bills. Last century’s wars were fought over who controlled the oil. This one may come down to who can keep the lights on for the machines.
The Global Emerging Markets Team
All Weather Capital
2 October 2026
This is a marketing communication for information only. It is not investment advice, research, or an offer or solicitation to buy or sell any security. Company names are illustrative of the theme, not recommendations. Emerging-market investments carry currency, liquidity, governance and political risk. You may get back less than invested. Past performance is not a guide to future results. Views are as at the date of writing and may change. Please refer to the fund’s offering documents and consult a professional adviser.
Disclaimer
All Weather Capital (Pty) Ltd is a South African authorised Category II and IIA financial services provider in terms of the Financial Advisory and Intermediary Services Act No. 37 of 2002 (“FAIS Act”) with FSP number 36722. The information contained herein, should not be construed as advice as defined in the FAIS Act, neither does it constitute a solicitation, invitation, or investment recommendation. Investors should take cognisance of the fact that there are risks involved when buying, selling, or investing in any financial product. The value of financial products can increase as well as decrease over time, depending on the value of the underlying securities and market conditions. Past returns may not be indicative of future returns, and an investor should seek independent professional financial, legal and tax advice relevant to their individual circumstances before making any investment decision.
This document is a general communication being provided for informational purposes only. It is educational in nature and not designed to be taken as advice or a recommendation for any specific investment product, strategy, or other purpose in any jurisdiction. All information contained herein is considered to be accurate as of the date of this Communication or as noted within the document and may not be accurate thereafter. All Weather has no obligation to update such information. Forward-looking statements are subject to numerous assumptions, risks, and uncertainties, which change over time. Actual results could differ materially from those anticipated in forward-looking statements. No representation is being made by the inclusion of the investment examples and strategies presented herein that the investment strategy will achieve performance similar to the investment examples and strategies herein or avoid losses.
Past performance is not indicative nor a guarantee of future results. An investment involves a significant degree of risk, and an investor may lose substantially all or all of their investment. Potential investors must familiarize themselves with the offering documentation and similar materials and must meet certain eligibility requirements in order to make such investment as well as be able to fully absorb the risks associate with such investment. The offering documentation and related materials will be made available in due course to those persons eligible for participation who demonstrate the capacity to evaluate the risks.